DB369 - Directional Bias 369
DB369 - Directional Bias 369 Indicator
The **DB369** indicator helps traders identify key market levels and trends by combining multiple timeframes' price action analysis. It highlights important **pivot points** on the chart and provides visual cues to help you make more informed buy and sell decisions based on the overall market direction.
Key Features
1. Pivot Points Across Multiple Timeframes**:
- The indicator calculates and displays pivot points for the **Monthly**, **Weekly**, **Daily**, **4-Hour**, and **1-Hour** timeframes (or 30-minute equivalent if desired). These pivots represent significant price levels where the market may retest.
2. **Trend Detection**:
- The indicator evaluates the relationship between the current price and the pivot point for each timeframe. Based on this comparison, it classifies the market as **Bullish**, **Bearish**, or **Neutral** on each timeframe.
3. **Pivot Lines**:
- Horizontal lines are drawn to mark the key pivot points for each selected timeframe. These lines extend into the future and adjust dynamically as the market moves in real time.
- **Customizable**: You can choose which timeframes to display pivot points by enabling/disabling them in the settings.
4. **Trend Table**:
- A **table** is displayed at the top-right of the chart to show the trend for the **Daily**, **4-Hour**, and **30-Minute** timeframes. It provides an easy-to-read view of the trend direction across these timeframes.
5. **Buy/Sell Arrows**:
- **Buy Arrow**: A green arrow will appear when the **Daily**, **4-Hour**, and **30-Minute** trends are all **Bullish** (aligned in the same direction).
- **Sell Arrow**: A red arrow will appear when all three timeframes show a **Bearish** trend.
- These arrows appear only once per alignment change and can be enabled or disabled for alerts. This helps avoid clutter on the chart and ensures that you only see a signal when the alignment occurs or changes.
### **How to Use the DB369 Indicator**:
1. **Pivot Points**:
- The pivot points represent significant price levels where the market might retest in the future. For instance:
- **Bullish Market**: If the price is above the pivot point, the market is considered bullish.
- **Bearish Market**: If the price is below the pivot point, the market is considered bearish.
- **Neutral Market**: When the price is near the pivot point, the market is neither strongly bullish nor bearish.
2. **Trend Alignment**:
- When the **Daily**, **4-Hour**, and **30-Minute** timeframes all show the same trend direction (either **Bullish** or **Bearish**), this alignment signifies a stronger trend.
- You will receive a **Buy Arrow** when all three timeframes are aligned bullish, and a **Sell Arrow** when they are aligned bearish.
- These arrows are displayed at the point when the alignment is first detected and can also trigger **alerts**.
3. **Alerts**:
- You can choose to enable alerts for when a **Buy** or **Sell** arrow appears on the chart. This allows you to be notified in real-time when the alignment conditions are met.
4. **Using the Pivot Points for Entry**:
- **Buy Trade**: Look for a buy trade when the price is near the **pivot line** of the higher timeframes, particularly when the trend across all three timeframes is **Bullish**.
- **Sell Trade**: Similarly, look for a sell trade when the price is near a **pivot line** and the trend is **Bearish**.
5. **Customization**:
- You can customize which timeframes' pivots are shown on the chart by toggling the visibility of the **Monthly**, **Weekly**, **Daily**, **4-Hour**, and **1-Hour** pivots in the settings.
- The indicator automatically adjusts the pivot levels in real-time as the market progresses.
**Important Notes**:
- This indicator does not guarantee successful trades; it is intended to assist in identifying potential trade opportunities based on the alignment of higher timeframe trends.
- Always combine the information from the DB369 indicator with other technical analysis tools and risk management strategies to ensure more accurate trade decisions.
스크립트에서 "pivot points"에 대해 찾기

yatsThis is a helper indicator for "yats" (Yet Another Trading Strategy).
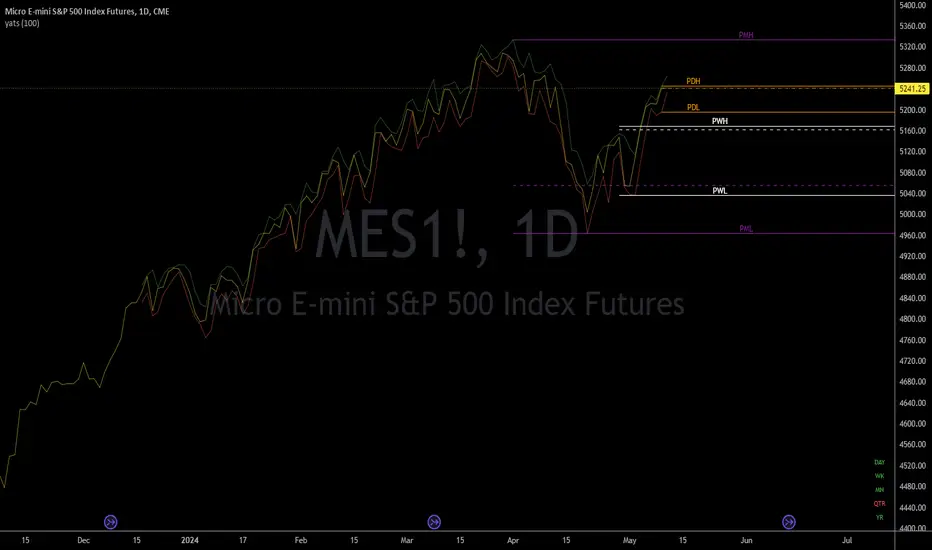
This is a grouping of several indicators in one to help with a very basic trend following strategy. In order to utilize this indicator, it is best to have your chart set to a Line chart.
How to use:
This is a basic trend strategy in which the trader will enter or reverse their position on the break of the trend.
With the chart set to line and the source set to close, a basic line with peaks and valleys is displayed.
When the line peaks, then retreats, this is a potential setup for a long position. The trader is to wait for a valley (lower point) to be formed and then for the previous peak to be broken.
The timeframe continuity labels in the lower right of the chart help to ensure the position taken is in line with the higher timeframe trend.
Example scenario (long):
Chart is set to 1H timeframe. Timeframe continuity indicator will have labels for 1H, 4H, Day, WK, MN, and QTR. Chart shows a peak at a close price of 5 then the next bar sets a valley at a close price of 4.
Next bar forms and sets a close price of 6. Timeframe continuity labels are green for 1H, 4H, Day, and WK. (At least three higher timeframes should match the direction of the desired trade.)
This is a signal to go long as the previous peak was broken and timeframe continuity is in the direction
of the trade (long). Initial conservative stoploss should be placed at the previous valley (4). A wider stoploss could be placed at the low created when the close was 4. This is made visible by the default red line
when Candle Highs and Lows plots are turned on. Stoploss is then trailed up either by each subsequent higher low, OR with each subsequent dip as price moves higher.
A target can be set, but is not an integral part of this strategy.
Features:
Full Timeframe Continuity:
In the lower right corner of the chart will be indicators for timeframes greater than or equal to the chart timeframe.
Each one will be Red, Green, or White to indicate down, up, or flat. This provides you with the direction of the higher timeframes in real time, before the bar has closed.
Potential Support/Resistance Points:
The indicator plots horizontal rays for the previous Day, Week, and Month for the High, Low, and Close. Day = Orange, Week = White, Month = Purple. High and Low are solid lines while Close is a dashed line.
This provides the trader with potential pivot points based on higher timeframe high, low, and close prices. The horizontal rays will automatically move to the right at the start of the newest day, week, or month.
Candle Highs and Lows:
Since the chart should be set to Line instead of Candles or Bars, this indicator provides plots that follow the Highs (Green) and Lows (Red) of each 'bar' of the chart timeframe. This has been made configurable
so these lines can be turned off or edited in the settings for those who do not want them on the chart or just want them to look different.
Pivot Extremes BreakoutI created the "Pivot Extremes Breakout" (PEB) indicator to easily spot breakout zones using pivot points. This tool comes from my need to anticipate market direction and capitalize on breakouts. PEB uses the last two pivot points to predict price paths and highlights potential breakout areas, adjusting for any timeframe. It simplifies seeing where the market might move next with color-coded lines and zones, aiming to improve your trading decisions.

Momentum-based ZigZag (incl. QQE) NON-REPAINTINGI spent a lot of time searching for the best ZigZag indicator. Difficulty with all of them is that they are always betting on some pre-defined rules which identify or confirm pivot points. Usually it is time factor - pivot point gets confirmed after a particular number of candles. This methodology is probably the best when market is moving relatively slow, but when price starts chopping up and down, there is no way the ZigZag follows accurately. On the other hand if you set it too tight (for example pivot confirmation after only 2 or even 1 candle), you will get hundreds of zigzag lines and they will tell you nothing.
My point of view is to follow the market. If it has reversed, then it has reversed, and there is no need to wait pre-defined number of candles for the confirmation. Such reversals will always be visible on momentum indicators, such as the most popular MACD. But a single-line moving average can be also good enough to notice reversals. Or my favourite one - QQE, which I borrowed (and improved) from JustUncleL, who borrowed it from Glaz, who borrowed it from... I don't even know where Quantitative Qualitative Estimation originates from. Thanks to all these guys for their input and code.
So whichever momentum indicator you choose - yes, there is a pick-your-poison-type selector as in in-famous Moving Average indicators - once it reverses, a highest (or lowest) point from the impulse is caught and ZigZag gets printed.
One thing I need to emphasize. This indicator DOES NOT REPAINT. It might look like the lines are a bit delayed, especially when compared to all the other ZigZag indicators on TradingView, but they are actually TRUE. There is a value in this - my indicator prints pivot points and Zigzag exactly on the moment they have been noticed, not earlier faking to be faster than they could be.
As a bonus, the indicator marks which impulse had strength in it. It is very nice to see a progressing impulse, but without force - a very likely that reversal on a bigger move is happening.
I'm about to publish some more scripts based on this ZigZag algo, so follow me on TradingView to get notified.
Enjoy!

Trend Key PointsEach trend has its high and low key points that are important in the next prices. Sometimes it's hard to find out the keys with a naked eye, so I tried to code a simple indicator to marking these points also, as a bonus, to draw support and resistance lines from previous critical pivot points.
Let me explain the details with a downtrend. If we consider the previous trend, each downtrend starts with a HH and end with a LL. There are always many tries between that HH and LL to turn the trend up. This indicator counts that inner attempts. The higher the number of attempts, the more important move has been started from the beginning (HH). These numbers take their final form when the trend ends and are included in the label at the beginning of each trend.
Key points with 3 and more inner tries are consider as critical point by default but It's alterable and you can change it as you want. The indicator draws lines from critical points too, so you can use that lines as support and resistance in next candles.
Likewise, there are marks below inner LLs and above inner HHs.
This indicator idea is entirely my own and is a product I've really thought about, AND you have allowed to use and share it anywhere to anyone. I did my best to make it useful, even so I am open to any improvement. If you have an idea or a suggestion, don't forget to leave a comment.

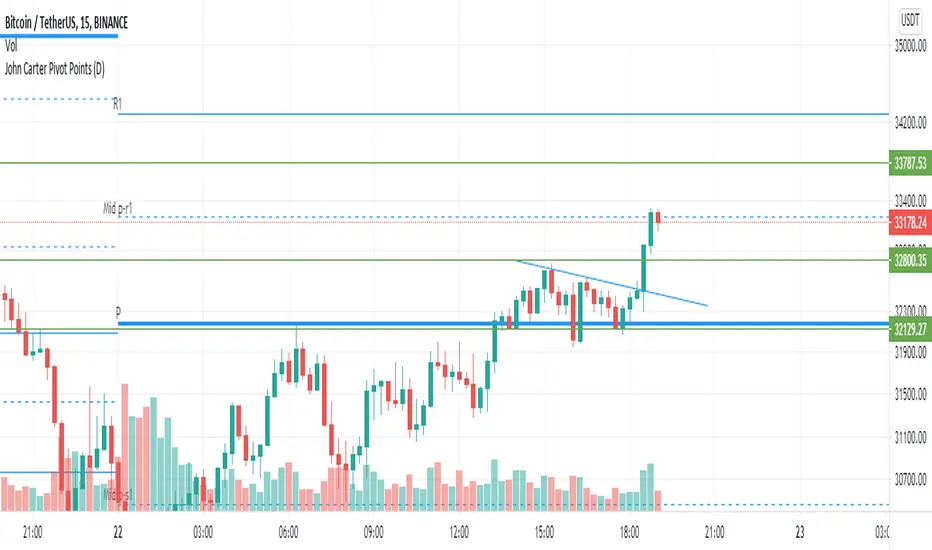
John Carter Pivot Points
This script is based on John Carter Mastering The Trade book. Pivot calculation is based on the previous day high, low, and close.
What Are the Trading Rules for Pivot Buys on Trending Days?
Sells are reversed.
1. Each day I update the appropriate pivot levels on the charts to reflect the previous day’s action. On Mondays, I also
update the weekly pivots, and on the first trading day of a new month, I update the monthly pivots.
2. The first pivot play is done in conjunction with the gap, if there is one. If there is a gap down, then I buy a decline into
the closest pivot level. If there isn’t a playable gap (more than 10 YM points or 1 ES point), then I will wait until
9:45 a.m. eastern to initiate the first play.
3. If the volume on the five-minute ES chart is more than 25,000 contracts, then I’ll wait for the markets to penetrate a
pivot level and move up at least a quarter of the way to the next pivot level. Once this happens, I will then set up a
bid to buy the first retracement back to the violated pivot level.
4. I enter my trades with limit orders only. I place orders “just in front of” the pivot. For the YM, I use 3 points; for the
ES, 0.25 point; for the NQ, 0.50 point; for the TF, 0.20 point; and for individual stocks, 5 cents. For example, if I’m
trading the YM and the pivot level is 10,000, then I would buy a decline to 10,003 and short a rally to 9997
.Sometimes the pivot will be an odd number, such as 1117.38 on the ES. In this case, I always round in the direction of
the trade. So, if I’m bidding for a long, I will round 1117.38 to 1117.50, and my bid will be 1117.75. If I’m offering a
short, I will round 1117.38 down to 1117.25 and place my offer at 1117.00. My stops and targets, then, would be “just
in front of” these appropriate long and short levels.
5. Once filled, I place an order to close the first half at the next pivot level and the second half at the pivot level after
that, using the same “just in front of” parameters.
6. I place a stop at 20 points for the YM, 2 points for the ES, 4 points for the NQ, and 1.50 points for the Russell. For
stocks, I will use a stop based roughly on the price of the stock. If the stock is under $10 a share, I will use a stop of
20 cents. If it is between $10 and $20, I will use a stop of 30 cents; if it is between $20 and $30, I will use a stop of
40 cents, and so on, adding another 10 cents for each $10 increment in price. (A $75 stock would have an 80-cent
stop, for example.)
7. If the first target is hit, I will then move up the stop to my entry-level pivot, minus the “just in front of” fractions
discussed in rule 3. For example, if I get in a YM long at 10,003 and the pivot is at 10,000, then my new stop would
be 9997 once the first target is hit.
8. If I am in a trade at the market close and neither my stop nor my target has been hit, I will close out my position “at the
market” at 4:10 p.m. eastern for futures, and at 3:58 p.m. eastern for stocks.
9. I don’t initiate any new positions after 3:30 p.m. eastern, but I will manage existing positions into the close.
10. The markets rarely have a sustained move above R3 or below S3. If I trade to those levels, I will always fade the
move.
11. After two losers in a row, I’m done with pivots for the day.
What Are the Trading Rules for Pivot Buys on Choppy Days?
Once again, sells are the same, just reversed. The rules for choppy days are identical except for the targets. On choppy days, I
just focus on the YM and the ES. My first target is mechanical: 10 points for the YM and 1 point for the ES on half of my
position. Once this is hit, I will trail up my stop in the same way I would for a trending trade. The second target becomes the
“just in front of” level for the actual next pivot level
Strategy - Bobo PAPATRHi I've revamped this bot mentioned in the linked idea to make it work with v4 of pine. In doing so there are some very significant changes to how it works. The main one is that it no longer uses traditional daily pivot calculations to calculate the bands. It creates a more dynamic intraday set of pivot points based on recent price action rather than yesterday's ohlc. As published, the bot is tuned for a 15 min time frame. But it actually works well on lower time frames you just need to adjust the lookback periods in settings a bit to re tune it. It's also tuned to ES really but will need tweaking for a different instrument at the very least.
The basic concept is recent price action is used to calculate a 'middle' around which red and green bands are located. Their position or width is largely determined by recent volatility. The middle line is again calculated from recent price action. The three lines from that form a tradeable range with green at the top and red at the bottom. The strategy is simple enough, it shorts as it sinks from outside red, and longs when rising above green. The basic principle being that once you enter that range you have a high probability of hitting the middle before you hit your stop loss. So the basic principle is you are trying to capture the inherent ranginess of liquid indices like S&P 500. That back and forth movement that happens. The bot is capturing this by fading extremes of a recent range but the problem with that is you'dd get murdered in a strong trend. To mitigate that there is a trend calculation running in the background the will prevent trading against firm trends mostly. So the bot should trade mostly in rangy conditions because that is what it is trying to do.
Bot will close issue close signals automatically upon crossing the middle, it also will close automatically at predefined stops or limits. These values are denominated in market mintick values. For example the CFD SPX500 has a mintick of 0.1. Therefore a stop value of 100 will equate to 10 points on the index. If trading the same market via ES1! the mintick value is different - 0.25. So in this case a value of 40 is required to set the stop at 10 points.
Anyway shout if you have questions. Hope it's useful.
TVC:SPX OANDA:SPX500USD

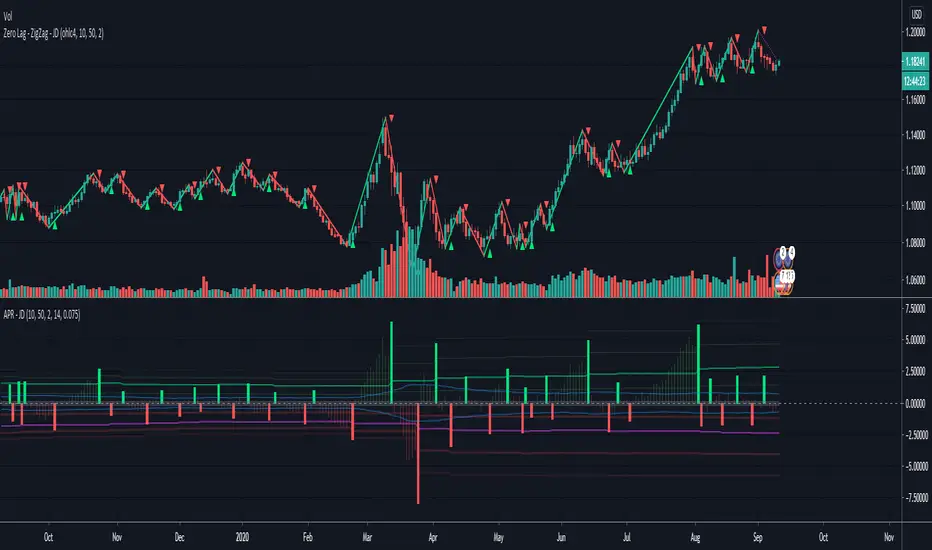
Average Pivot Range - JDThe "Average Pivot Indicator" is an alternative to the "Average True Range"
and is based in "pivot points" calculated with a Jurik ma, (same as the "Zero-Lag"ZigZag")
the indicator calculates the range in the price swing between the two last pivot points.
A green/red candle shows the range that price has risen/fallen since the last swing low/high
As with the normal ATR, this can be used to set price targets, stoplosses, to gauge volatility,...
I added an option to insert a commission/fee percentage to make it easy to see if a timeframe is worth trading
or if you will likely get "eaten" by fees.
(note the fee should be entered per transaction!! The indicator will calculate it one time for entry and once for exit)
The indicator can be displayed in percentage (upper chart) or in absolute value/ticks (lower chart)
The normal ATR is added too, so you don't have to chose which one you add to your chart! ;-)
if you find other uses, please leave your ideas in the comments!
Shoutout to Everget for the awesome Jurik code!!
JD.
#NotTradingAdvice
#DYOR
I build these indicators for myself and provide them open source, to use for free to use and improve upon,
as I believe the best way to learn is toghether.
Eminaest Pivots V2Simple Pivot Points plotting script.
You can choose to plot Daily, Weekly and Monthly Pivot Points. Separate or two of them or all together.

Enhanced MTF Bias Table by Odegos# Enhanced MTF Bias Table - Publication Description
## Short Description (for TradingView listing)
Multi-timeframe bias indicator combining Market Structure Shifts (MSS) with EMA analysis. Displays real-time bias across 7 timeframes (5m-Weekly) with distance metrics and volatility measurements. Perfect for identifying trend alignment and potential reversal points.
---
## Full Description
### Overview
The **Enhanced MTF Bias Table** is a comprehensive multi-timeframe analysis tool designed to help traders quickly identify market bias across different time horizons. By combining Market Structure Shift (MSS) detection with Exponential Moving Average (EMA) analysis, this indicator provides a clear, color-coded view of market sentiment from short-term (5-minute) to long-term (weekly) timeframes.
### What This Indicator Does
**Core Functionality:**
- **Multi-Timeframe Analysis**: Simultaneously monitors 7 different timeframes (5m, 15m, 30m, 1h, 4h, Daily, Weekly)
- **Market Structure Detection**: Identifies when price breaks previous swing highs/lows, indicating potential trend changes
- **EMA-Based Bias**: Combines market structure with price distance from a customizable EMA to determine bias strength
- **Visual Market Structure Shifts**: Draws horizontal lines on the chart when significant market structure shifts occur
- **Real-Time Metrics**: Displays distance from EMA and ATR (volatility) for each timeframe
### How It Works
**Bias Calculation Logic:**
The indicator uses a sophisticated two-factor approach to determine market bias:
1. **Market Structure Analysis**:
- Tracks swing highs and lows using pivot points
- Identifies when price breaks above previous highs (bullish structure) or below previous lows (bearish structure)
- Uses a customizable lookback period to filter noise
2. **EMA Distance Analysis**:
- Measures how far price is from the selected EMA
- Strong bias requires BOTH structure break AND significant distance from EMA
- Neutral zone prevents false signals when price consolidates near the EMA
**Bias Categories:**
- **Strong ↑** (Dark Green): Bullish market structure + price above EMA threshold
- **Weak ↑** (Light Green): Bullish structure OR price moderately above EMA
- **Neutral** (Orange): Price within neutral zone around EMA
- **Weak ↓** (Light Red): Bearish structure OR price moderately below EMA
- **Strong ↓** (Dark Red): Bearish market structure + price below EMA threshold
### Key Features
**📊 Customizable Table Display:**
- Two table styles: Compact (minimal) or Full (detailed with labels)
- 9 position options to fit any chart layout
- Toggle distance from EMA and ATR displays
- Shows current symbol, timeframe, and date
**📈 Flexible Indicator Settings:**
- Adjustable EMA length (default: 50)
- Customizable MSS lookback period (5-50 bars)
- Breakout threshold adjustment for different instruments
- Neutral zone configuration to reduce noise
**📍 Visual Market Structure Shifts:**
- Draws horizontal lines at significant structure breaks
- Customizable colors for bullish/bearish MSS
- Optional text labels ("MSS") for easy identification
- Adjustable line width and style (solid, dashed, dotted)
**📉 EMA Overlay:**
- Optional EMA display on chart
- Full customization: color, width, line style
- Helps visualize the reference point for bias calculations
**🎨 Full Color Customization:**
- Independent color controls for all bias levels
- Customize header and table appearance
- Matches any chart theme or preference
### Best Use Cases
**1. Trend Alignment:**
Use the MTF table to identify when multiple timeframes align in the same direction. When 5-6 or more timeframes show the same bias, it indicates strong directional momentum.
**2. Divergence Detection:**
Look for disagreements between timeframes. For example, if higher timeframes (Daily/Weekly) show bearish bias while lower timeframes (5m/15m) show bullish bias, it may indicate a counter-trend bounce or potential reversal setup.
**3. Entry Timing:**
Use higher timeframe bias for direction and lower timeframe bias for entry timing. Enter trades when your trading timeframe aligns with higher timeframe bias.
**4. Risk Management:**
When lower timeframes show opposite bias to higher timeframes, it suggests trading against the major trend—requiring tighter stops and smaller positions.
**5. Market Structure Confirmation:**
The MSS lines help identify key levels where market structure changed, useful for:
- Stop loss placement (below/above MSS levels)
- Target setting (previous structure points)
- Breakout confirmation
### Recommended Settings by Instrument
**Index Futures:**
- **ES (S&P 500)**: Breakout Threshold: 0.15%, Neutral Zone: 0.15%
- **NQ (Nasdaq)**: Breakout Threshold: 0.25%, Neutral Zone: 0.20%
- **YM (Dow Jones)**: Breakout Threshold: 0.20%, Neutral Zone: 0.20%
**Forex Pairs:**
- **Major Pairs**: Breakout Threshold: 0.10%, Neutral Zone: 0.10%
- **Volatile Pairs**: Breakout Threshold: 0.20%, Neutral Zone: 0.15%
**Cryptocurrencies:**
- Breakout Threshold: 0.30-0.50%, Neutral Zone: 0.25-0.40%
- Higher volatility requires larger thresholds
### Understanding the Metrics
**Distance from EMA (%):**
- Positive values = Price above EMA (bullish territory)
- Negative values = Price below EMA (bearish territory)
- Larger absolute values = Stronger deviation from mean
- Useful for identifying overextended moves
**ATR (%):**
- Measures current volatility as percentage of price
- Higher values = More volatile conditions
- Helps adjust position sizing and stop distances
- Compare across timeframes to see where volatility concentrates
### Tips for Optimal Use
1. **Start with higher timeframes**: Check Daily and Weekly bias first to understand the bigger picture
2. **Use the 50 EMA default**: It's widely used and provides reliable support/resistance
3. **Adjust MSS lookback for your style**: Lower values (5-7) for day trading, higher values (15-25) for swing trading
4. **Watch for neutral zones**: Orange/neutral readings often precede significant moves
5. **Combine with price action**: Use MSS lines as reference points for entries and exits
6. **Don't ignore weak signals**: "Weak" bias often precedes strong moves as structure builds
### What Makes This Different
Unlike simple moving average indicators, this script:
- Combines TWO confirmation factors (structure + distance) for more reliable signals
- Provides context across multiple timeframes simultaneously
- Visually marks important market structure changes on your chart
- Offers both compact and detailed display modes
- Includes volatility measurement to gauge market conditions
### Technical Notes
- Uses `request.security()` to fetch data from multiple timeframes
- Implements `pivothigh()` and `pivotlow()` for swing detection
- All calculations use `lookahead=barmerge.lookahead_off` to prevent repainting
- MSS lines drawn in real-time as structure breaks occur
- Optimized for performance with minimal script resources
### Disclaimer
This indicator is a tool for analysis and does not provide trading signals or financial advice. Always:
- Use proper risk management
- Combine with other forms of analysis
- Test thoroughly in a demo environment
- Understand that past performance doesn't guarantee future results
- Consider market conditions and fundamental factors
---
## Tags (for TradingView)
multi-timeframe, market-structure, bias, trend, EMA, momentum, support-resistance, price-action, volatility, ATR, swing-trading, day-trading
## Category
Trend Analysis / Multi-Timeframe Analysis
---
## Quick Start Guide
**For Day Traders:**
1. Add indicator to your chart
2. Focus on 5m, 15m, 30m, and 1h timeframes
3. Look for alignment across these timeframes
4. Use MSS lines as entry/exit reference points
**For Swing Traders:**
1. Add indicator to your chart
2. Focus on 4h, Daily, and Weekly timeframes
3. Wait for 2-3 timeframe alignment
4. Use lower timeframes only for entry timing
**For Position Traders:**
1. Add indicator to your chart
2. Focus on Daily and Weekly timeframes
3. Ignore short-term noise
4. Enter when both show same strong bias

RSI Cascade DivergencesRSI Cascade Divergences is a tool for detecting divergences between price and RSI with an extended cascade-based strength accumulation logic. A “cascade” represents a sequence of multiple divergences linked through RSI pivot points. The indicator records RSI pivots, checks whether a divergence is present, assigns a strength value to each structure, and displays only signals that meet your minimum strength thresholds.
How Divergence Logic Works
The indicator identifies local RSI extremes (pivots) based on Pivot Length and Pivot Confirm.
For every confirmed pivot it stores:
the RSI value at the pivot,
the corresponding value of the RSI Source price,
the pivot’s bar index.
How a Divergence Is Formed
A divergence is detected when two consecutive RSI pivots of the same type show opposite dynamics relative to the price source defined in RSI Source (default: close), not relative to chart highs/lows.
Bearish divergence: the price source value at the second pivot is higher, but RSI forms a lower high.
Bullish divergence: the price source value at the second pivot is lower, but RSI forms a higher low.
The indicator does not use price highs/lows — only the selected price source at the pivot points.
Cascade Strength Calculation
Each new pivot is compared only with the previous pivot of the same type.
A cascade grows in strength if:
divergence conditions are met,
the difference in RSI values exceeds Min. RSI Distance,
the previous structure already had some strength or the previous pivot was formed in the OB/OS zone.
If the divergence occurs as RSI exits OB/OS, strength is additionally increased by +1.
Behavior in Strong Trends
Divergences may appear repeatedly and even form cascades with high strength. However, if price does not react meaningfully, this indicates strong trend pressure.
In such cases, divergences stop functioning as reversal signals:
RSI attempts to counter-move, but the dominant trend continues.
The indicator accurately reflects this — cascades may form but fail to trigger any reversal, which itself suggests a powerful, persistent trend.
Filtering and Context Reset
To avoid retaining irrelevant pivots:
when RSI is above Overbought → low pivots are cleared;
when RSI is below Oversold → high pivots are cleared.
This prevents false cascades during extreme RSI conditions.
Input Parameters
RSI Source — price source used in RSI calculations (close, hl2, ohlc4, etc.).
RSI Length — RSI calculation period.
Overbought / Oversold — RSI threshold zones.
Pivot Length — number of bars to the left required for a pivot.
Pivot Confirm — bars to the right required to confirm the pivot.
Min. RSI Distance — minimum difference between two pivot RSI values for the divergence to be considered meaningful.
Min. Strength (Bull / Bear) — minimum accumulated strength for:
confirming the signal,
displaying the strength label,
triggering alerts.
Weaker signals below these thresholds appear as dashed guide structures.
Visual
Display settings for lines, markers, and colors.
These parameters do not affect the indicator logic.
Important
Divergences — including cascades — should not be used as a standalone trading signal.
Always combine them with broader market context, trend analysis, structure, volume, and risk management tools.

reversalLibrary "reversals"
psar(af_start, af_increment, af_max)
Calculates Parabolic Stop And Reverse (SAR)
Parameters:
af_start (simple float) : Initial acceleration factor (Wilder's original: 0.02)
af_increment (simple float) : Acceleration factor increment per new extreme (Wilder's original: 0.02)
af_max (simple float) : Maximum acceleration factor (Wilder's original: 0.20)
Returns: SAR value (stop level for current trend)
fractals()
Detects Williams Fractal patterns (5-bar pattern)
Returns: Tuple with fractal values (na if no fractal)
swings(lookback, source_high, source_low)
Detects swing highs and swing lows using lookback period
Parameters:
lookback (simple int) : Number of bars on each side to confirm swing point
source_high (float) : Price series for swing high detection (typically high)
source_low (float) : Price series for swing low detection (typically low)
Returns: Tuple with swing point values (na if no swing)
pivot(tf)
Calculates classic/standard/floor pivot points
Parameters:
tf (simple string) : Timeframe for pivot calculation ("D", "W", "M")
Returns: Tuple with pivot levels
pivotcam(tf)
Calculates Camarilla pivot points with 8 levels for short-term trading
Parameters:
tf (simple string) : Timeframe for pivot calculation ("D", "W", "M")
Returns: Tuple with pivot levels
pivotdem(tf)
Calculates d-mark pivot points with conditional open/close logic
Parameters:
tf (simple string) : Timeframe for pivot calculation ("D", "W", "M")
Returns: Tuple with pivot levels (only 3 levels)
pivotext(tf)
Calculates extended traditional pivot points with R4-R5 and S4-S5 levels
Parameters:
tf (simple string) : Timeframe for pivot calculation ("D", "W", "M")
Returns: Tuple with pivot levels
pivotfib(tf)
Calculates Fibonacci pivot points using Fibonacci ratios
Parameters:
tf (simple string) : Timeframe for pivot calculation ("D", "W", "M")
Returns: Tuple with pivot levels
pivotwood(tf)
Calculates Woodie's pivot points with weighted closing price
Parameters:
tf (simple string) : Timeframe for pivot calculation ("D", "W", "M")
Returns: Tuple with pivot levels

Market Structure Pivots TrendThis indicator identifies and visualizes key market structure by plotting confirmed, non-repainting pivot points. It goes beyond simple markers by classifying the pivots, extending dynamic support/resistance lines, and providing a visual representation of the current trend state.
Key Features:
Non-Repainting Pivot Detection:
Uses a standard lookback method (left and right bars) to identify historical pivot points.
Note on Confirmation: Pivots are only confirmed after the Pivot Right Bars input has passed. This is essential for ensuring the signal is non-repainting, but it introduces an inherent lag.
Automatically classifies the sequence of pivots according to Dow Theory: Higher Highs (HH), Higher Lows (HL), Lower Highs (LH), and Lower Lows (LL).
Pivot Classification Filter:
Price Tolerance Filter: A user-defined percentage tolerance filters out insignificant market noise. A pivot is only classified as 'Higher' or 'Lower' if its price exceeds the previous one by more than the set tolerance, leading to more robust signals.
Equal Pivot Detection: The tolerance also enables the detection of Equal Highs (EH) and Equal Lows (EL), highlighting consolidation zones.
Dynamic Support & Resistance Lines:
When enabled, the indicator extends a horizontal line from the most recent confirmed pivot high and low.
These lines update in real-time, providing clear S/R levels.
Lines automatically terminate if the price decisively breaks through them or if a new pivot of the same type is formed.
Trend State Visualization:
A built-in state machine analyzes the sequence of pivots and breaks to determine the current market trend (Uptrend, Downtrend, or Neutral).
Plots a dynamic step-line based on recent highs/lows to visually represent the current trend state.
Full Customization & Alerts:
Display Options: Choose between simple triangles or detailed text labels that show the pivot type, price, and the absolute or relative change from the previous pivot of the same type.
Visual Styling: Full control over colors for all six pivot types (HH, LH, EH, LL, HL, EL) and line styles.
Comprehensive Alerts: Set up alerts for every new pivot formation (e.g., HH, LL), for S/R line breaks, and for changes in the overall trend state (Up, Down, Neutral).
DISCLAIMER
For Informational/Educational Use Only: This indicator is provided for informational and educational purposes only. It does not constitute financial, investment, or trading advice, nor is it a recommendation to buy or sell any asset.
Use at Your Own Risk: All trading decisions you make based on the information or signals generated by this indicator are made solely at your own risk.
No Guarantee of Performance: Past performance is not an indicator of future results. The author makes no guarantee regarding the accuracy of the signals or future profitability.
No Liability: The author shall not be held liable for any financial losses or damages incurred directly or indirectly from the use of this indicator.
Signals Are Not Recommendations: The alerts and visual signals (e.g., crossovers) generated by this tool are not direct recommendations to buy or sell. They are technical observations for your own analysis and consideration.

Price Trendlines + Break Signals█ OVERVIEW
The "Price Trendlines + Break Signals" indicator is a technical analysis tool that automatically draws trendlines based on price pivot points and detects breakout signals. Designed for traders seeking precise market signals, the indicator identifies key pivot points, draws trendlines (resistance and support), and generates breakout signals with background highlighting. It offers flexible settings and alerts for breakout signals.
█ CONCEPTS
The indicator was created to provide traders with an alternative source of signals based on trendlines. Breakouts and bounces from trendlines can signal a trend change or the end of a correction. Combining these signals with other technical analysis tools can form the basis for building diverse trading strategies.
█ FEATURES
-Pivot Point Calculation: The indicator identifies pivot points (pivot high and pivot low) based on the closing price, with configurable left and right bars for pivot detection. Setting a higher number of bars results in fewer but more significant trendlines, with a delay corresponding to the specified length. Lower values generate more trendlines, but they are less significant. Crossovers are signaled only after the trendline is drawn, so sometimes no signals appear on crossed trendlines—this indicates the price passed through the line before it was detected.
- Trendlines: Draws trendlines connecting price pivot points—upper lines for downtrends (resistance) and lower lines for uptrends (support). Lines can be extended by a specified number of bars (default: 50).
- Tolerance Margin: Trendlines are widened by a tolerance margin, calculated using the average candle body size over a specified period and its multiplier. Reducing the multiplier to zero leaves only the trendline without a margin. Breaking this zone is a condition for generating signals.
- Breakout Signals: Generates signals when the price breaks through a trendline (bullish for upper lines, bearish for lower lines), with background highlighting for signal confirmation.
Alerts: Built-in alerts for:
- Upper trendline breakout (bullish signal).
- Lower trendline breakout (bearish signal).
Customization: Allows adjustment of pivot parameters, trendline extension length, tolerance margin, line colors, fills, and signal background transparency.
█ HOW TO USE
Adding the Indicator: Add the indicator to your TradingView chart via the Pine Editor or Indicators menu.
Configuring Settings:
- Left Bars for Pivot: Number of bars back for detecting pivots (default: 10).
- Right Bars for Pivot: Number of bars forward to confirm pivots (default: 10).
- Extend past 2nd pivot: Number of bars to extend the trendline after the second pivot (default: 50, 0 = no extension).
- Average Body Periods: Period for calculating the average candle body size used for the tolerance margin (default: 100).
- Tolerance Multiplier: Multiplier for the tolerance margin based on the average candle body size (default: 1.0).
Colors and Style:
- Upper trendline (resistance): default red.
- Lower trendline (support): default green.
- Line fills: colors with transparency (default 70).
- Signal background: green for bullish signals, red for bearish signals (default transparency 85).
Interpreting Signals:
- Trendlines: Upper lines (red) indicate a downtrend, lower lines (green) indicate an uptrend. Signals appear after a trendline breakout with the tolerance margin. Each trendline generates only one breakout signal, though it may still act as resistance or support for the price.
- Breakout Signals: Green background indicates an upper trendline breakout (bullish), red background indicates a lower trendline breakout (bearish).
- Alerts: Set up alerts in TradingView for trendline breakout signals.
Combining with Other Tools: Use with support/resistance levels, Fibonacci levels, RSI, pivot points, or FVG (Fair Value Gap) for signal confirmation.
█ APPLICATIONS
The "Price Trendlines + Break Signals" indicator is designed to identify trends and potential reversal points, supporting both trend-following and contrarian strategies:
- Trend Confirmation: Trendlines indicate the direction of the price trend, and bounces from them may signal the end of a correction.
- Reversal Strategies: Breakout signals can be used as cues to enter positions in anticipation of a trend change or correction.
- Noise Filtering: The tolerance margin reduces false signals, enhancing reliability.
█ NOTES
- Trendline crossovers are signaled only after the trendline is drawn, so sometimes no signals appear on crossed trendlines—this indicates the price passed through the line before it was detected.
- Each trendline generates only one breakout signal, though it may still act as a level of support or resistance for the price.
- Setting a higher number of bars for pivots results in fewer but more significant trendlines, with a delay corresponding to the specified length. Lower values generate more trendlines, but they are less significant.
- Adjust settings (e.g., number of bars for pivots, tolerance multiplier) to suit your trading style and timeframe.
- Combine with other technical analysis tools, such as RSI, pivot points, or FVG, to enhance signal accuracy.
- For high-volatility markets, consider increasing the tolerance margin to reduce false signals.

Trend Lines by Pivots (Enhanced)### **📌 Detailed Explanation of the TradingView Indicator Code**
This **Pine Script v5** indicator automatically **detects trend lines** based on pivot highs and pivot lows. It helps traders visualize **support and resistance levels** using dynamic trend lines.
---
## **🔹 How the Indicator Works**
The indicator identifies **key pivot points** in price action and then **draws trend lines** connecting them. It works as follows:
1. **Detects Pivot Highs and Lows**:
- A **pivot high** is a local maximum where the price is higher than surrounding bars.
- A **pivot low** is a local minimum where the price is lower than surrounding bars.
2. **Stores the Last Two Pivot Points**:
- The script remembers the last **two pivot highs** and **two pivot lows**.
- These points are used to **draw resistance and support lines** dynamically.
3. **Plots Resistance and Support Lines**:
- The script continuously **updates** and **extends** the trend lines to the right as new pivots are found.
- **Red Line (Resistance):** Connects the last two pivot highs.
- **Green Line (Support):** Connects the last two pivot lows.
---
## **🔹 Code Breakdown**
### **1️⃣ Inputs for User Customization**
```pinescript
leftLen = input.int(2, "Left Pivot Length")
rightLen = input.int(2, "Right Pivot Length")
highLineColor = input.color(color.red, "Resistance Line Color")
lowLineColor = input.color(color.green, "Support Line Color")
```
- **leftLen & rightLen:** Define how many bars on the left and right should be used to confirm a pivot.
- **highLineColor:** Sets the color of the resistance trend line (default: **red**).
- **lowLineColor:** Sets the color of the support trend line (default: **green**).
---
### **2️⃣ Detect Pivot Highs & Lows**
```pinescript
pivotHigh = ta.pivothigh(leftLen, rightLen)
pivotLow = ta.pivotlow(leftLen, rightLen)
```
- `ta.pivothigh(leftLen, rightLen)`: Detects a **pivot high** if it's the highest price in a certain range.
- `ta.pivotlow(leftLen, rightLen)`: Detects a **pivot low** if it's the lowest price in a certain range.
---
### **3️⃣ Store the Last Two Pivot Points**
#### **🔺 Storing Resistance (Pivot Highs)**
```pinescript
var float lastPivotHigh1 = na
var int lastPivotHighIndex1 = na
var float lastPivotHigh2 = na
var int lastPivotHighIndex2 = na
```
- These variables store **the last two pivot highs** and their **bar indices** (position on the chart).
#### **🔻 Storing Support (Pivot Lows)**
```pinescript
var float lastPivotLow1 = na
var int lastPivotLowIndex1 = na
var float lastPivotLow2 = na
var int lastPivotLowIndex2 = na
```
- These variables store **the last two pivot lows** and their **bar indices**.
---
### **4️⃣ Update Pivot Points When New Ones Are Found**
#### **Updating Resistance (Pivot Highs)**
```pinescript
if not na(pivotHigh)
lastPivotHigh2 := lastPivotHigh1
lastPivotHighIndex2 := lastPivotHighIndex1
lastPivotHigh1 := pivotHigh
lastPivotHighIndex1 := bar_index - rightLen
```
- If a new **pivot high** is found:
- The **previous pivot** becomes `lastPivotHigh2`.
- The **new pivot** becomes `lastPivotHigh1`.
- The index (`bar_index - rightLen`) marks where the pivot occurred.
#### **Updating Support (Pivot Lows)**
```pinescript
if not na(pivotLow)
lastPivotLow2 := lastPivotLow1
lastPivotLowIndex2 := lastPivotLowIndex1
lastPivotLow1 := pivotLow
lastPivotLowIndex1 := bar_index - rightLen
```
- Similar to pivot highs, this section updates **pivot lows** dynamically.
---
### **5️⃣ Create and Update Trend Lines**
#### **🔺 Drawing the Resistance Line**
```pinescript
var line highLine = na
if not na(lastPivotHigh2) and not na(lastPivotHigh1)
if na(highLine)
highLine := line.new(lastPivotHighIndex2, lastPivotHigh2, lastPivotHighIndex1, lastPivotHigh1, color=highLineColor, extend=extend.right)
else
line.set_xy1(highLine, lastPivotHighIndex2, lastPivotHigh2)
line.set_xy2(highLine, lastPivotHighIndex1, lastPivotHigh1)
line.set_color(highLine, highLineColor)
```
- If **two pivot highs** exist:
- **First time:** Creates a new **resistance line** connecting them.
- **Updates dynamically:** Adjusts the line when a new pivot appears.
#### **🔻 Drawing the Support Line**
```pinescript
var line lowLine = na
if not na(lastPivotLow2) and not na(lastPivotLow1)
if na(lowLine)
lowLine := line.new(lastPivotLowIndex2, lastPivotLow2, lastPivotLowIndex1, lastPivotLow1, color=lowLineColor, extend=extend.right)
else
line.set_xy1(lowLine, lastPivotLowIndex2, lastPivotLow2)
line.set_xy2(lowLine, lastPivotLowIndex1, lastPivotLow1)
line.set_color(lowLine, lowLineColor)
```
- Same logic applies for **support levels**, creating or updating a **green trend line**.
---
## **🔹 How to Use This Indicator**
1. **Apply the script in TradingView**:
- Open **Pine Script Editor** → Paste the code → Click **"Add to Chart"**.
2. **Interpret the Lines**:
- **Red line (Resistance):** Price may struggle to break above it.
- **Green line (Support):** Price may bounce off it.
3. **Trading Strategy**:
- **Breakout Strategy:**
- If the price **breaks resistance**, expect a bullish move.
- If the price **breaks support**, expect a bearish move.
- **Reversal Trading:**
- Look for **bounces off support/resistance** for potential reversals.
---
## **🔹 Key Features of This Indicator**
✅ **Automatically detects pivot highs and lows.**
✅ **Draws real-time trend lines for support and resistance.**
✅ **Updates dynamically with new price action.**
✅ **Customizable settings for pivot sensitivity and colors.**
This indicator is useful for **trend traders, breakout traders, and support/resistance traders**. 🚀
Let me know if you need **further improvements or additional features!** 😊

Higher Time Frame Support/Resistance [BigBeluga]The Higher Time Frame Support/Resistance indicator is a tool designed to display pivot points derived from higher timeframes on your current chart. These pivot points are calculated based on the highs and lows of price action in different timeframes, and the indicator draws horizontal lines to represent these levels. These lines act as potential support and resistance zones, giving traders key market levels that may influence future price movement.
Each pivot line is color-coded and labeled with its price value and the timeframe it originates from. This allows traders to clearly differentiate between the significance of the levels based on their timeframe. For example, weekly pivot levels may represent stronger, more long-term support and resistance, while hourly pivots offer more immediate, short-term levels to watch.
🔵 IDEA
The Higher Time Frame Support/Resistance indicator is designed to simplify the process of tracking key support and resistance levels across multiple timeframes. Pivot points, which represent turning points in the market, are essential for identifying areas where price might reverse or break out. By displaying these levels from higher timeframes directly on the current chart, traders can quickly identify and react to critical areas in the market without needing to switch between different timeframe charts.
The indicator labels each pivot point with the specific timeframe it comes from (e.g., 4H, 1D, 1W), making it easy for traders to assess the relative strength of each level. Stronger levels from higher timeframes are likely to act as more significant barriers or support zones, while lower timeframe levels can be used for more precise entries and exits.
🔵 KEY FEATURES
Pivot Levels from Multiple Timeframes:
The indicator calculates pivot highs and lows from various higher timeframes (e.g., 4H, 1D, 1W) and plots these levels on the current chart. These pivot points are represented by horizontal lines that extend across the chart, serving as potential support and resistance zones.
Color-Coded Support and Resistance Lines:
Each pivot level is color-coded based on its timeframe, helping traders quickly differentiate between short-term and long-term support and resistance. This visual aid simplifies the analysis and allows for a clearer understanding of key market levels.
Price Labels and Timeframe Information:
In addition to the pivot lines, the indicator displays labels at each level with the corresponding price and timeframe. For example, a label may show "D Pivot High" followed by the exact price. This helps traders understand the origin and significance of each line, allowing for more informed trading decisions.
Labels up and down mark highs and lows from higher timeframes:
Pivot Shadows for Enhanced Clarity:
The indicator can also draw shadow lines that represent the pivot points but with increased transparency. These shadows allow traders to keep track of previous pivots without cluttering the chart with too many solid lines. The width and transparency of these shadows can be customized in the settings.
🔵 HOW TO USE
🔵 CUSTOMIZATION
Timeframes and Pivot Length: Customize which higher timeframes (e.g., 4H, 1D, 1W) you want to display pivot levels from. Adjust the pivot length to control how sensitive the indicator is in detecting market highs and lows.
Line Style and Colors: Adjust the line style (solid, dashed, dotted) and colors for each timeframe to match your personal preference or chart theme. This customization helps in maintaining a clear and visually appealing chart.
Shadow Line Width and Transparency: Control the width and transparency of the shadow pivot lines to reduce chart clutter while still keeping track of key historical levels.

[FS] Pivot Measurements# Pivot Measurements
An advanced TradingView indicator that combines LuxAlgo's pivot point detection algorithm with automatic measurement calculations between consecutive pivots.
## Features
### Pivot Detection
- **Regular Pivots**: Detects standard pivot highs and lows using configurable pivot length
- **Missed Pivots**: Identifies missed reversal levels that occurred between regular pivots
- **Visual Indicators**:
- Regular pivot highs: Red downward triangle (▼)
- Regular pivot lows: Teal upward triangle (▲)
- Missed pivots: Ghost emoji (👻)
- **Zigzag Lines**: Connects pivots with colored lines (solid for regular, dashed for missed)
- **Ghost Levels**: Horizontal lines indicating missed pivot levels
### Measurement System
- **Automatic Measurements**: Calculates price movements between consecutive pivots
- **Visual Display**:
- Transparent colored boxes (blue for upward, red for downward movements)
- Measurement labels showing:
- Price change (absolute and percentage)
- Duration (bars, days, hours, minutes)
- Volume approximation
- **Smart Positioning**: Labels positioned outside boxes (above for upward, below for downward)
- **Color Coding**: Blue for positive movements, red for negative movements
## Parameters
### Pivot Detection
- **Pivot Length** (default: 50): Number of bars on each side to identify a pivot point
- **Regular Pivots**: Toggle and colors for regular pivot highs and lows
- **Missed Pivots**: Toggle and colors for missed pivot detection
### Measurements
- **Number of Measurements** (1-10, default: 10): Maximum number of measurements to display
- **Show Measurement Boxes**: Toggle to show/hide measurement boxes and labels
- **Box Transparency** (0-100, default: 90): Transparency level for measurement boxes
- **Border Transparency** (0-100, default: 50): Transparency level for box borders
- **Label Background Transparency** (0-100, default: 30): Transparency level for label backgrounds
- **Label Size**: Size of measurement labels (tiny, small, normal, large)
## Usage
1. Add the indicator to your chart
2. Configure the **Pivot Length** based on your timeframe:
- Lower values for shorter timeframes (e.g., 10-20 for 1-5 min)
- Higher values for longer timeframes (e.g., 50-100 for daily)
3. Adjust pivot colors and visibility as needed
4. Customize measurement display settings:
- Set the number of measurements to display
- Adjust transparency levels for boxes, borders, and labels
- Choose label size
## Technical Details
- **Pine Script Version**: v6
- **Pivot Detection**: Based on () algorithm for detecting regular and missed pivots
- **Measurement Calculation**:
- Measures between consecutive pivots (from most recent to older)
- Calculates price change, percentage change, duration, and approximate volume
- Automatically sorts pivots chronologically
- **Performance**: Optimized with helper functions to reduce code duplication
## Notes
- The indicator automatically limits the number of stored pivots to optimize performance
- Measurements are only created when there are at least 2 pivots detected
- All measurements are recalculated on each bar update
- The indicator uses `max_bars_back=5000` to ensure sufficient historical data
## License
This indicator uses LuxAlgo's pivot detection algorithm from (). Please refer to the original LuxAlgo license for pivot detection components.

RSI Trendlines and Divergences█OVERVIEW
The "RSI Trendlines and Divergences" indicator is an advanced technical analysis tool that leverages the Relative Strength Index (RSI) to draw trendlines and detect divergences. Designed for traders seeking precise market signals, the indicator identifies key pivot points on the RSI chart, draws trendlines between pivots, and detects bullish and bearish divergences. It offers flexible settings, background coloring for breakout signals, and divergence labels, supported by alerts for key events. The indicator is universal and works across all markets (stocks, forex, cryptocurrencies) and timeframes.
█CONCEPTS
The indicator was developed to provide an alternative signal source for the RSI oscillator. Trendline breakouts and bounces off trendlines offer a broader perspective on potential price behavior. Combining these with traditional RSI signal interpretation can serve as a foundation for creating various trading strategies.
█FEATURES
- RSI and Pivot Calculation: Calculates RSI based on the selected source price (default: close) with a customizable period (default: 14). Identifies pivot points on RSI and price for trendlines and divergences.
- RSI Trendlines: Draws trendlines connecting RSI pivots (upper for downtrends, lower for uptrends) with optional extension (default: 30 bars). The trendline appears and generates a signal only after the first RSI crossover. Lines are colored (red for upper, green for lower).
- Trendline Fill: Widens the trendline with a tolerance margin expressed in RSI points, reducing signal noise and visually highlighting trend zones. Breaking this zone is a condition for generating signals, minimizing false signals. The tolerance margin can be increased or decreased.
- Divergence Detection: Identifies bullish and bearish divergences based on RSI and price pivots, displaying labels (“Bull” for bullish, “Bear” for bearish) with adjustable transparency. Divergence labels appear with a delay equal to the specified pivot length (default: 5). Higher values yield stronger signals but with greater delay.
- Breakout Signals: Generates signals when RSI crosses the trendline (bullish for upper lines, bearish for lower lines), with background coloring for signal confirmation.
- Alerts: Built-in alerts for:
Detection of bullish and bearish divergences.
Upper trendline crossover (bullish signal).
Lower trendline crossover (bearish signal).
- Customization: Allows adjustment of RSI length, pivot settings, line colors, fills, labels, and transparency of signals and background.
█HOW TO USE
Add the indicator to your TradingView chart via the Pine Editor or Indicators menu.
Configuring Settings.
RSI Settings
- RSI Length: Period for RSI calculation (default: 14).
- SMA Length: Period for RSI moving average (default: 9).
- Source: Source price for RSI (default: close).
Pivot Settings for Trend
- Left Bars for Pivot: Number of bars back for detecting pivots (default: 10).
- Right Bars for Pivot: Number of bars forward for confirming pivots (default: 10).
- Extension after Second Pivot: Number of bars to extend the trendline (default: 30, 0 = none). Extension increases the number of signals, while shortening reduces them.
- Tolerance: Deviation in RSI points to widen the breakout margin, reducing signal noise (default: 3.0).
Divergence Settings
- Enable Divergence Detection: Enables/disables divergence detection (default: enabled).
- Pivot Length for Divergence: Pivot period for divergences (default: 5).
Style Settings
- Upper Trendline Color: Color for downtrend lines (default: red).
- Upper Fill Color: Fill color for upper lines (default: red, transparency 70).
- Lower Trendline Color: Color for uptrend lines (default: green).
- Lower Fill Color: Fill color for lower lines (default: green, transparency 70).
- SMA Color: Color for RSI moving average (default: yellow).
- Bullish Divergence Color: Color for bullish labels (default: green).
- Bearish Divergence Color: Color for bearish labels (default: red).
- Text Color: Color for label text (default: white).
- Divergence Label Transparency: Transparency of labels (0-100, default: 40).
- Signal Background Transparency: Transparency of breakout signal background (0-100, default: 80).
Interpreting Signals
- Trendlines: Upper lines (red) indicate RSI downtrends, lower lines (green) indicate uptrends. The trendline appears and generates a signal only after the first RSI crossover. Trendline breakouts suggest potential trend reversals.
- Divergences: “Bull” labels indicate bullish divergence (potential rise), “Bear” labels indicate bearish divergence (potential decline), with a delay based on pivot length (default: 5). Divergences serve as confirmation or warning of trend reversal, not as standalone signals.
- Signal Background: Green background signals bullish breakouts, red background signals bearish breakouts.
- RSI Levels: Horizontal lines at 70 (overbought), 50 (midline), and 30 (oversold) help assess market zones.
- Alerts: Set up alerts in TradingView for divergences or trendline breakouts.
Combining with Other Tools: Use with support/resistance levels, Fibonacci levels, or other indicators for signal confirmation.
█APPLICATIONS
The "RSI Trendlines and Divergence" indicator is designed to identify trends and potential reversal points, supporting both trend-following and reversal strategies:
- Trend Confirmation: Trendlines indicate the RSI trend direction, with breakouts signaling potential reversals. The indicator is functional in traditional RSI usage, allowing classic RSI interpretation (e.g., returning from overbought/oversold zones). Combining trendline breakouts with RSI signal levels, such as a return from overbought or oversold zones paired with a trendline breakout, strengthens the signal.
- Divergence Detection: Divergences serve as confirmation or warning of trend reversal, not as standalone signals.
█NOTES
- Adjust settings (e.g., RSI length, pivots, tolerance) to suit your trading style and timeframe.
- Combine with other technical analysis tools to enhance signal accuracy.

Levels Of Interest------------------------------------------------------------------------------------
LEVELS OF INTEREST (LOI)
TRADING INDICATOR GUIDE
------------------------------------------------------------------------------------
Table of Contents:
1. Indicator Overview & Core Functionality
2. VWAP Foundation & Historical Context
3. Multi-Timeframe VWAP Analysis
4. Moving Average Integration System
5. Trend Direction Signal Detection
6. Visual Design & Display Features
7. Custom Level Integration
8. Repaint Protection Technology
9. Practical Trading Applications
10. Setup & Configuration Recommendations
------------------------------------------------------------------------------------
1. INDICATOR OVERVIEW & CORE FUNCTIONALITY
------------------------------------------------------------------------------------
The LOI indicator combines multiple VWAP calculations with moving averages across different timeframes. It's designed to show where institutional money is flowing and help identify key support and resistance levels that actually matter in today's markets.
Primary Functions:
- Multi-timeframe VWAP analysis (Daily, Weekly, Monthly, Yearly)
- Advanced moving average integration (EMA, SMA, HMA)
- Real-time trend direction detection
- Institutional flow analysis
- Dynamic support/resistance identification
Target Users: Day traders, swing traders, position traders, and institutional analysts seeking comprehensive market structure analysis.
------------------------------------------------------------------------------------
2. VWAP FOUNDATION & HISTORICAL CONTEXT
------------------------------------------------------------------------------------
Historical Development: VWAP started in the 1980s when big institutional traders needed a way to measure if they were getting good fills on their massive orders. Unlike regular price averages, VWAP weighs each price by the volume traded at that level. This makes it incredibly useful because it shows you where most of the real money changed hands.
Mathematical Foundation: The basic math is simple: you take each price, multiply it by the volume at that price, add them all up, then divide by total volume. What you get is the true "average" price that reflects actual trading activity, not just random price movements.
Formula: VWAP = Σ(Price × Volume) / Σ(Volume)
Where typical price = (High + Low + Close) / 3
Institutional Behavior Patterns:
- When price trades above VWAP, institutions often look to sell
- When it's below, they're usually buying
- Creates natural support and resistance that you can actually trade against
- Serves as benchmark for execution quality assessment
------------------------------------------------------------------------------------
3. MULTI-TIMEFRAME VWAP ANALYSIS
------------------------------------------------------------------------------------
Core Innovation: Here's where LOI gets interesting. Instead of just showing daily VWAP like most indicators, it displays four different timeframes simultaneously:
**Daily VWAP Implementation**:
- Resets every morning at market open
- Provides clearest picture of intraday institutional sentiment
- Primary tool for day trading strategies
- Most responsive to immediate market conditions
**Weekly VWAP System**:
- Resets each Monday (or first trading day)
- Smooths out daily noise and volatility
- Perfect for swing trades lasting several days to weeks
- Captures weekly institutional positioning
**Monthly VWAP Analysis**:
- Resets at beginning of each calendar month
- Captures bigger institutional rebalancing at month-end
- Fund managers often operate on monthly mandates
- Significant weight in intermediate-term analysis
**Yearly VWAP Perspective**:
- Resets annually for full-year institutional view
- Shows long-term institutional positioning
- Where pension funds and sovereign wealth funds operate
- Critical for major trend identification
Confluence Zone Theory: The magic happens when multiple VWAP levels cluster together. These confluence zones often become major turning points because different types of institutional money all see value at the same price.
------------------------------------------------------------------------------------
4. MOVING AVERAGE INTEGRATION SYSTEM
------------------------------------------------------------------------------------
Multi-Type Implementation: The indicator includes three types of moving averages, each with its own personality and application:
**Exponential Moving Averages (EMAs)**:
- React quickly to recent price changes
- Displayed as solid lines for easy identification
- Optimal performance in trending market conditions
- Higher sensitivity to current price action
**Simple Moving Averages (SMAs)**:
- Treat all historical data points equally
- Appear as dashed lines in visual display
- Slower response but more reliable in choppy conditions
- Traditional approach favored by institutional traders
**Hull Moving Averages (HMAs)**:
- Newest addition to the system (dotted line display)
- Created by Alan Hull in 2005
- Solves classic moving average dilemma: speed vs. accuracy
- Manages to be both responsive and smooth simultaneously
Technical Innovation: Alan Hull's solution addresses the fundamental problem where moving averages are either too slow (missing moves) or too fast (generating false signals). HMAs achieve optimal balance through weighted calculation methodology.
Period Configuration:
- 5-period: Short-term momentum assessment
- 50-period: Intermediate trend identification
- 200-period: Long-term directional confirmation
------------------------------------------------------------------------------------
5. TREND DIRECTION SIGNAL DETECTION
------------------------------------------------------------------------------------
Real-Time Momentum Analysis: One of LOI's best features is its real-time trend detection system. Next to each moving average, visual symbols provide immediate trend assessment:
Symbol System:
- ▲ Rising average (bullish momentum confirmation)
- ▼ Falling average (bearish momentum indication)
- ► Flat average (consolidation or indecision period)
Update Frequency: These signals update in real-time with each new price tick and function across all configured timeframes. Traders can quickly scan daily and weekly trends to assess alignment or conflicting signals.
Multi-Timeframe Trend Analysis:
- Simultaneous daily and weekly trend comparison
- Immediate identification of trend alignment
- Early warning system for potential reversals
- Momentum confirmation for entry decisions
------------------------------------------------------------------------------------
6. VISUAL DESIGN & DISPLAY FEATURES
------------------------------------------------------------------------------------
Color Psychology Framework: The color scheme isn't random but based on psychological associations and trading conventions:
- **Blue Tones**: Institutional neutrality (VWAP levels)
- **Green Spectrum**: Growth and stability (weekly timeframes)
- **Purple Range**: Longer-term sophistication (monthly analysis)
- **Orange Hues**: Importance and attention (yearly perspective)
- **Red Tones**: User-defined significance (custom levels)
Adaptive Display Technology: The indicator automatically adjusts decimal places based on the instrument you're trading. High-priced stocks show 2 decimals, while penny stocks might show 8. This keeps the display incredibly clean regardless of what you're analyzing - no cluttered charts or overwhelming information overload.
Smart Labeling System: Advanced positioning algorithm automatically spaces all elements to prevent overlap, even during extreme zoom levels or multiple timeframe analysis. Every level stays clearly readable without any visual chaos disrupting your analysis.
------------------------------------------------------------------------------------
7. CUSTOM LEVEL INTEGRATION
------------------------------------------------------------------------------------
User-Defined Level System: Beyond the calculated VWAP and moving average levels, traders can add custom horizontal lines at any price point for personalized analysis.
Strategic Applications:
- **Psychological Levels**: Round numbers, previous significant highs/lows
- **Technical Levels**: Fibonacci retracements, pivot points
- **Fundamental Targets**: Analyst price targets, earnings estimates
- **Risk Management**: Stop-loss and take-profit zones
Integration Features:
- Seamless incorporation with smart labeling system
- Custom color selection for visual organization
- Extension capabilities across all chart timeframes
- Maintains display clarity with existing indicators
------------------------------------------------------------------------------------
8. REPAINT PROTECTION TECHNOLOGY
------------------------------------------------------------------------------------
Critical Trading Feature: This addresses one of the most significant issues in live trading applications. Most multi-timeframe indicators "repaint," meaning they display different signals when viewing historical data versus real-time analysis.
Protection Benefits:
- Ensures every displayed signal could have been traded when it appeared
- Eliminates discrepancies between historical and live analysis
- Provides realistic performance expectations
- Maintains signal integrity across chart refreshes
Configuration Options:
- **Protection Enabled**: Default setting for live trading
- **Protection Disabled**: Available for backtesting analysis
- User-selectable toggle based on analysis requirements
- Applies to all multi-timeframe calculations
Implementation Note: With protection enabled, signals may appear one bar later than without protection, but this ensures all signals represent actionable opportunities that could have been executed in real-time market conditions.
------------------------------------------------------------------------------------
9. PRACTICAL TRADING APPLICATIONS
------------------------------------------------------------------------------------
**Day Trading Strategy**:
Focus on daily VWAP with 5-period moving averages. Look for bounces off VWAP or breaks through it with volume. Short-term momentum signals provide entry and exit timing.
**Swing Trading Approach**:
Weekly VWAP becomes your primary anchor point, with 50-period averages showing intermediate trends. Position sizing based on weekly VWAP distance.
**Position Trading Method**:
Monthly and yearly VWAP provide broad market context, while 200-period averages confirm long-term directional bias. Suitable for multi-week to multi-month holdings.
**Multi-Timeframe Confluence Strategy**:
The highest-probability setups occur when daily, weekly, and monthly VWAPs cluster together, especially when multiple moving averages confirm the same direction. These represent institutional consensus zones.
Risk Management Integration:
- VWAP levels serve as dynamic stop-loss references
- Multiple timeframe confirmation reduces false signals
- Institutional flow analysis improves position sizing decisions
- Trend direction signals optimize entry and exit timing
------------------------------------------------------------------------------------
10. SETUP & CONFIGURATION RECOMMENDATIONS
------------------------------------------------------------------------------------
Initial Configuration: Start with default settings and adjust based on individual trading style and market focus. Short-term traders should emphasize daily and weekly timeframes, while longer-term investors benefit from monthly and yearly level analysis.
Transparency Optimization: The transparency settings allow clear price action visibility while maintaining level reference points. Most traders find 70-80% transparency optimal - it provides a clean, unobstructed view of price movement while maintaining all critical reference levels needed for analysis.
Integration Strategy: Remember that no indicator functions effectively in isolation. LOI provides excellent context for institutional flow and trend direction analysis, but should be combined with complementary analysis tools for optimal results.
Performance Considerations:
- Multiple timeframe calculations may impact chart loading speed
- Adjust displayed timeframes based on trading frequency
- Customize color schemes for different market sessions
- Regular review and adjustment of custom levels
------------------------------------------------------------------------------------
FINAL ANALYSIS
------------------------------------------------------------------------------------
Competitive Advantage: What makes LOI different is its focus on where real money actually trades. By combining volume-weighted calculations with multiple timeframes and trend detection, it cuts through market noise to show you what institutions are really doing.
Key Success Factor: Understanding that different timeframes serve different purposes is essential. Use them together to build a complete picture of market structure, then execute trades accordingly.
The integration of institutional flow analysis with technical trend detection creates a comprehensive trading tool that addresses both short-term tactical decisions and longer-term strategic positioning.
------------------------------------------------------------------------------------
END OF DOCUMENTATION
------------------------------------------------------------------------------------

Fractal Breakout Trend Following System█ OVERVIEW
The Fractal Breakout Trend Following System is a custom technical analysis tool designed to pinpoint significant fractal pivot points and breakout levels. By analyzing price action through configurable pivot parameters, this indicator dynamically identifies key support and resistance zones. It not only marks crucial highs and lows on the chart but also signals potential trend reversals through real-time breakout detections, helping traders capture shifts in market momentum.
█ KEY FEATURES
Fractal Pivot Detection
Utilizes user-defined left and right pivot lengths to detect local highs (pivot highs) and lows (pivot lows). This fractal-based approach ensures that only meaningful price moves are considered, effectively filtering out minor market noise.
Dynamic Line Visualization
Upon confirmation of a pivot, the system draws a dynamic line representing resistance (from pivot highs) or support (from pivot lows). These lines extend across the chart until a breakout occurs, offering a continuous visual guide to key levels.
Trend Breakout Signals
Monitors for price crossovers relative to the drawn pivot lines. A crossover above a resistance line signals a bullish breakout, while a crossunder below a support line indicates a bearish move, thus updating the prevailing trend.
Pivot Labelling
Assigns labels such as "HH", "LH", "LL", or "HL" to detected pivots based on their relative values.
It uses the following designations:
HH (Higher High) : Indicates that the current pivot high is greater than the previous pivot high, suggesting continued upward momentum.
LH (Lower High) : Signals that the current pivot high is lower than the previous pivot high, which may hint at a potential reversal within an uptrend.
LL (Lower Low) : Shows that the current pivot low is lower than the previous pivot low, confirming sustained downward pressure.
HL (Higher Low) : Reveals that the current pivot low is higher than the previous pivot low, potentially indicating the beginning of an upward reversal in a downtrend.
These labels provide traders with immediate insight into the market structure and recent price behavior.
Customizable Visual Settings
Offers various customization options:
• Adjust pivot sensitivity via left/right pivot inputs.
• Toggle pivot labels on or off.
• Enable background color changes to reflect bullish or bearish trends.
• Choose preferred colors for bullish (e.g., green) and bearish (e.g., red) signals.
█ UNDERLYING METHODOLOGY & CALCULATIONS
Fractal Pivot Calculation
The script employs a sliding window technique using configurable left and right parameters to identify local highs and lows. Detected pivot values are sanitized to ensure consistency in subsequent calculations.
Dynamic Line Plotting
When a new pivot is detected, a corresponding line is drawn from the pivot point. This line extends until the price breaks the level, at which point it is reset. This method provides a continuous reference for support and resistance.
Trend Breakout Identification
By continuously monitoring price interactions with the pivot lines, the indicator identifies breakouts. A price crossover above a resistance line suggests a bullish breakout, while a crossunder below a support line indicates a bearish shift. The current trend is updated accordingly.
Pivot Label Assignment
The system compares the current pivot with the previous one to determine if the move represents a higher high, lower high, higher low, or lower low. This classification helps traders understand the underlying market momentum.
█ HOW TO USE THE INDICATOR
1 — Apply the Indicator
• Add the Fractal Breakout Trend Following System to your chart to begin visualizing dynamic pivot points and breakout signals.
2 — Adjust Settings for Your Market
• Pivot Detection – Configure the left and right pivot lengths for both highs and lows to suit your desired sensitivity:
- Use shorter lengths for more responsive signals in fast-moving markets.
- Use longer lengths to filter out minor fluctuations in volatile conditions.
• Visual Customization – Toggle the display of pivot labels and background color changes. Select your preferred colors for bullish and bearish trends.
3 — Interpret the Signals
• Support & Resistance Lines – Observe the dynamically drawn lines that represent key pivot levels.
• Pivot Labels – Look for labels like "HH", "LH", "LL", and "HL" to quickly assess market structure and trend behavior.
• Trend Signals – Watch for price crossovers and corresponding background color shifts to gauge bullish or bearish breakouts.
4 — Integrate with Your Trading Strategy
• Use the identified pivot points as potential support and resistance levels.
• Combine breakout signals with other technical indicators for comprehensive trade confirmation.
• Adjust the sensitivity settings to tailor the indicator to various instruments and market conditions.
█ CONCLUSION
The Fractal Breakout Trend Following System offers a robust framework for identifying critical fractal pivot points and potential breakout opportunities. With its dynamic line plotting, clear pivot labeling, and customizable visual settings, this indicator equips traders with actionable insights to enhance decision-making and optimize entry and exit strategies.

Breakout and Retest Signals [AlgoAlpha]OVERVIEW
This script detects breakout and retest signals by identifying key pivot points in price action and analyzing their relationship with historical swing highs and lows. It highlights breakout structures using ATR-based tolerance levels and volume analysis to confirm potential trend continuations or reversals. The script marks significant price levels with dynamic boxes and dashed lines to help traders visualize breakout and retest areas effectively.
CONCEPTS
The script relies on pivot point analysis, a technique used to identify significant price levels where the market has previously reversed. It dynamically tracks a set number of recent swing highs and lows, allowing traders to see if the price is revisiting a previously significant level. The concept of breakouts and retests is widely used in technical analysis to determine potential entry points. A breakout occurs when the price moves beyond a resistance or support level, and a retest happens when the price returns to test that level before continuing in the breakout direction. This script enhances that analysis by incorporating ATR-based tolerance levels, ensuring that price zones are not too large.
FEATURES
Breakout and Retest Markings : Highlights breakout and retest areas with shaded boxes, allowing traders to visualize where price action is confirming key levels.
Volume Delta and Ratio : Analyzes volume at breakout levels to gauge the strength of the move, displaying volume delta information for additional context. The script also displays the ratio of selling to buying at the retest along traders to make better judgement on their entries.
Multi-Timeframe Adaptability : Dynamically adjusts volume analysis to align with the appropriate lower timeframe, ensuring reliable volume comparisons.
Alerts for Breakout and Retest Events : Traders can receive real-time notifications when bullish or bearish breakout retests are detected.
USAGE
This script is best suited for traders looking to identify strong breakout and retest setups across different timeframes. Users can customize the pivot detection period and swing point memory to adjust sensitivity based on their trading style. The ATR length and multiplier allow further refinement of breakout tolerance, reducing noise in volatile markets. The breakout zones are displayed as shaded boxes, where traders can assess whether a price retest is occurring under favorable conditions. Alerts can be set to notify traders of potential trade opportunities.

Dual Zigzag [Trendoscope®]🎲 Dual Zigzag indicator is built on recursive zigzag algorithm. It is very similar to other zigzag indicators published by us and other authors. However, the key point here is, the indicator draws zigzag on both price and any other plot based indicator on separate layouts.
Before we get into the indicator, here are some brief descriptions of the underlying concepts and key terminologies
🎯 Zigzag
Zigzag indicator breaks down price or any input series into a series of Pivot Highs and Pivot Lows alternating between each other. Zigzags though shows pivot high and lows, should not be used for buying at low and selling at high. The main application of zigzag indicator is for the visualisation of market structure and this can be used as basic building block for any pattern recognition algorithms.
🎯 Recursive Zigzag Algorithm
Recursive zigzag algorithm builds zigzag on multiple levels and each level of zigzag is based on the previous level pivots. The level zero zigzag is built on price. However, for level 1, instead of price level 0 zigzag pivots are used. Similarly for level 2, level 1 zigzag pivots are used as base.
🎲 Components Dual Zigzag Indicator
Here are the components of Dual zigzag indicator
Built in Oscillator - Indicator has built in oscillator options for plotting RSI (Relative Strength Index), MFI (Money Flow Index), cci (Commodity Channel Index) , CMO (Chande Momentum Oscillator), COG (Center of Gravity), and ROC (Rate of Change). Apart from the given built in oscillators, users can also use a custom external output as base. The oscillators are not printed on the price pane. But, printed on a separate indicator overlay.
Zigzag On Oscillator - Recursive zigzag is calculated and printed on the oscillator series. Each pivot high and pivot low also prints a label having the retracement ratios, and price levels at those points. Zigzag on the oscillator is also printed on the indicator overlay pane.
Zigzag on Price - Recursive zigzag calculated based on price and printed on the price pane. This is made possible by using force_overlay option present in the drawing objects. At each zigzag pivot levels, the label having price retracement ratios, and oscillator values are printed.
It is called dual zigzag because, the indicator calculates the zigzag on both price and oscillator series of values and prints them separately on different panes on the chart.
🎲 Indicator Settings
Settings include
Theme display settings to get the right colour combination to match the background.
Zigzag settings to be used for zigzag calculation and display
Oscillator settings to chose the oscillator to be used as base for 2nd zigzag
🎲 Applications
Useful in spotting divergences with both indicator and price having their own zigzag to highlight pivots
Spotting patterns in indicators/oscillators and correlate them with the patterns on price
🎲 Using External Input
If users want to use an external indicator such as OBV instead of the built in oscillators, then can do so by using the custom option.
Here is how this can be done.
Step1. Add both Dual Zigzag and the intended indicator (in this case OBV) on the chart. Notice that both OBV and Dual zigzag appear on different panes.
Step2. Edit the indicator settings of Dual zigzag and set custom indicator by selecting "custom" as oscillator name and then by setting the custom external indicator name and input.
Step 3. You would notice that the zigzag in Dual Zigzag indictor pane is already showing the zigzag pivots based on the OBV indicator and the price pivots display obv values at the pivot points. We can leave this as is.
Step 4. As an additional step, you can also merge the OBV pane and the Dual zigzag indicator pane into one by going into OBV settings and moving the indicator to above pane. Merge the scales so that there is no two scales on the same pane and the entire scale appear on the right.
At the end, you should see two panes - one with price and other with OBV and both having their zigzag plotted.

Daksh RSI POINT to ShootHere are the key points and features of the Pine Script provided:
### 1. **Indicator Settings**:
- The indicator is named **"POINT and Shoot"** and is set for non-overlay (`overlay=false`) on the chart.
- `max_bars_back=4000` is defined, indicating the maximum number of bars that the script can reference.
### 2. **Input Parameters**:
- `Src` (Source): The price source, default is `close`.
- `rsilen` (RSI Length): The length for calculating RSI, default is 20.
- `linestylei`: Style for the trend lines (`Solid` or `Dashed`).
- `linewidth`: Width of the plotted lines, between 1 and 4.
- `showbroken`: Option to show broken trend lines.
- `extendlines`: Option to extend trend lines.
- `showpivot`: Show pivot points (highs and lows).
- `showema`: Show a weighted moving average (WMA) line.
- `len`: Length for calculating WMA, default is 9.
### 3. **RSI Calculation**:
- Calculates a custom RSI value using relative moving averages (`ta.rma`), and optionally uses On-Balance Volume (`ta.obv`) if `indi` is set differently.
- Plots RSI values as a green or red line depending on its position relative to the WMA.
### 4. **Pivot Points**:
- Utilizes the `ta.pivothigh` and `ta.pivotlow` functions to detect pivot highs and lows over the defined period.
- Stores up to 10 recent pivot points for highs and lows.
### 5. **Trend Line Drawing**:
- Lines are drawn based on pivot highs and lows.
- Calculates potential trend lines using linear interpolation and validates them by checking if subsequent bars break or respect the trend.
- If the trend is broken, and `showbroken` is enabled, it draws dotted lines to represent these broken trends.
### 6. **Line Management**:
- Initializes multiple lines (`l1` to `l20` and `t1` to `t20`) and uses these lines for drawing uptrend and downtrend lines.
- The maximum number of lines is set to 20 for uptrends and 20 for downtrends, due to a limit on the total number of lines that can be displayed on the chart.
### 7. **Line Style and Color**:
- Defines different colors for uptrend lines (`ulcolor = color.red`) and downtrend lines (`dlcolor = color.blue`).
- Line styles are determined by user input (`linestyle`) and use either solid or dashed patterns.
- Broken lines use a dotted style to indicate invalidated trends.
### 8. **Pivot Point Plotting**:
- Plots labels "H" and "L" for pivot highs and lows, respectively, to visually indicate turning points on the chart.
### 9. **Utility Functions**:
- Uses helper functions to get the values and positions of the last 10 pivot points, such as `getloval`, `getlopos`, `gethival`, and `gethipos`.
- The script uses custom logic for line placement based on whether the pivots are lower lows or higher highs, with lines adjusted dynamically based on price movement.
### 10. **Plotting and Visuals**:
- The main RSI line is plotted using a color gradient based on its position relative to the WMA.
- Horizontal lines (`hline1` and `hline2`) are used for visual reference at RSI levels of 60 and 40.
- Filled regions between these horizontal lines provide visual cues for potential overbought or oversold zones.
These are the main highlights of the script, which focuses on trend detection, visualization of pivot points, and dynamic line plotting based on price action.
